Skip to content
SeeItFlow
About SeeItFlow

Software engineering makes more sense when you can see it happen.

SeeItFlow is a free library of lessons on system design, backend systems, databases, networking, core concepts and AI engineering. The lessons show how systems behave — the requests, state changes, failures and trade-offs — and connect what you watch to the engineering reasoning behind it. This page explains how they are made and who makes them.

What you'll find here

176 modules across 8 engineering domains, in three formats.

Each format is built so that you see a system working before you are asked to reason about it.

System designs · 31 modules

Real-world systems such as ride-hailing, payments and messaging, each taught in 5 lessons: Complete Design, Architecture Deep Dive, Trade-offs & Decisions, Failure & Scale Scenarios and Interview Perspective. Complete Design includes a narrated visual design journey that evolves the architecture as load, failures and requirements change.

Technologies · 17 modules

Backend Systems, Databases and Networking topics such as Kafka, PostgreSQL and TCP, each taught in 4 lessons: Fundamentals, Production Engineering, Engineering Insights and Interview & Revision. Fundamentals includes a narrated visual journey through the system’s internals.

Focused lessons · 128 modules

Core Concepts, Architecture, Production Engineering and AI are taught as single-page lessons. Most pair the written explanation with narrated, animated scenes of the mechanism being described.

What a visual journey is

A visual journey is a step-by-step, narrated walkthrough of one system in motion. You can play and pause it, step forward and back, and replay any moment. Its steps change the system’s state — a new partition leader, a dropped packet, a new row version — and the narration explains why.

Why it exists

Understanding a system is easier when you can see how it behaves.

Blog posts, documentation and static diagrams are useful for explaining what a system is. But some engineering concepts become much easier to understand when you can also see how the pieces interact, how data moves, and what changes when something fails.

SeeItFlow was built around that idea — making system behavior visible, then connecting what you see to the engineering reasoning behind it.

  • What happens step by step, not just what the thing is called.
  • How the pieces actually talk to each other under real traffic.
  • Why a design decision was made, and what it traded away.
  • What changes when a dependency slows down or fails outright.
  • What the system looks like in production — not in a textbook.

SeeItFlow exists to make those relationships — and the reasoning behind them — something you can see, not just something you're told.

How lessons are made

How a topic becomes a lesson.

Making a complex system feel simple is mostly work you don’t see. This is how a lesson is built.

The test every architecture change has to pass

For every major change in a system design journey, the learner should be able to answer: why did the architecture change here? If the answer only exists in the text and cannot be understood from the visual cause and effect, the scene is not finished.

  1. Scope the questions first.

    Before anything is drawn, a technology topic is outlined as the questions an engineer needs answered: what it is, why it exists, how it works internally, how it behaves in production, what it trades off, where people go wrong, and how it comes up in interviews.

  2. Research the mechanism, not just the vocabulary.

    Explanations draw on official documentation, specifications and established engineering papers. Lessons reference sources such as the HTTP and TCP RFCs, Kafka Improvement Proposals, and papers like Raft and Dynamo. Where behaviour depends on configuration or version, the lesson says so.

  3. Start from the problem.

    A mechanism is introduced after the learner has seen the situation that makes it necessary. In the ride-hailing design, a load balancer appears when one server can no longer keep up, and atomic assignment appears after two riders have both been matched to the same driver.

  4. Model the system, then draw it.

    Each visual journey is driven by a model of the system’s state: partition leaders and in-sync replicas, sequence and acknowledgement numbers, transaction IDs and row versions. The diagram is rendered from that state, so what changes on screen corresponds to something that changed in the system.

  5. Script the narration against the scene.

    Narration is written step by step to follow what is on screen and to explain why it changed, rather than reading the diagram aloud. It is delivered using a synthetic voice.

  6. Publish, then keep refining.

    Publishing is not the last step. Lessons are revisited to fix technical errors, unclear explanations and visual problems such as clipped labels or animation that runs ahead of the narration. When a correction changes the content, the page’s update date changes with it.

See it for yourself

Four things that are hard to grasp from a paragraph.

Each example below is a real scene from a published lesson. They are easier to understand when you watch them happen than when you read a description.

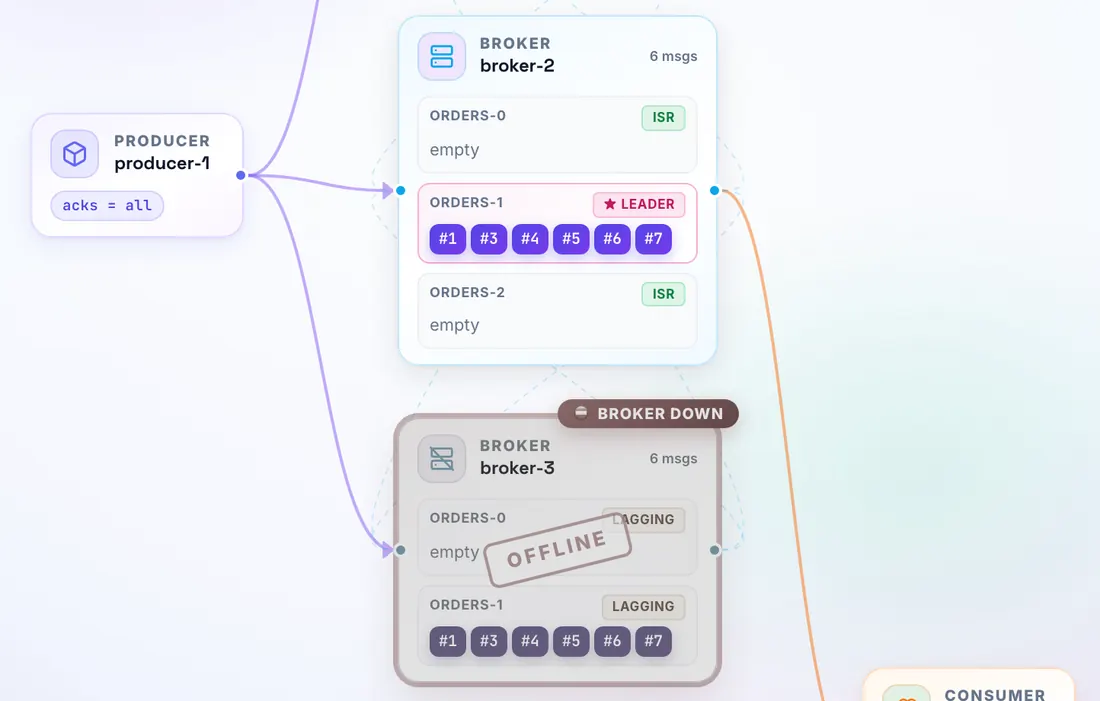
Kafka journey during a broker failure: broker-3 is down and its replicas are marked lagging, while broker-2 leads partition orders-1 with in-sync replicas and the producer keeps writing with acks=all.

Backend Systems · Kafka Fundamentals · Scene 9, Broker Failure & Recovery

Kafka: when a broker fails

Replication is easy to define and hard to picture. The journey tracks each partition’s leader, its in-sync replicas and every follower’s progress. When a broker crashes, you see it drop out of the ISR, the controller elect a new leader from the remaining in-sync replicas, and writes continue because the ISR still meets min.insync.replicas. Then the broker catches up and rejoins.

Open the Kafka visual journey
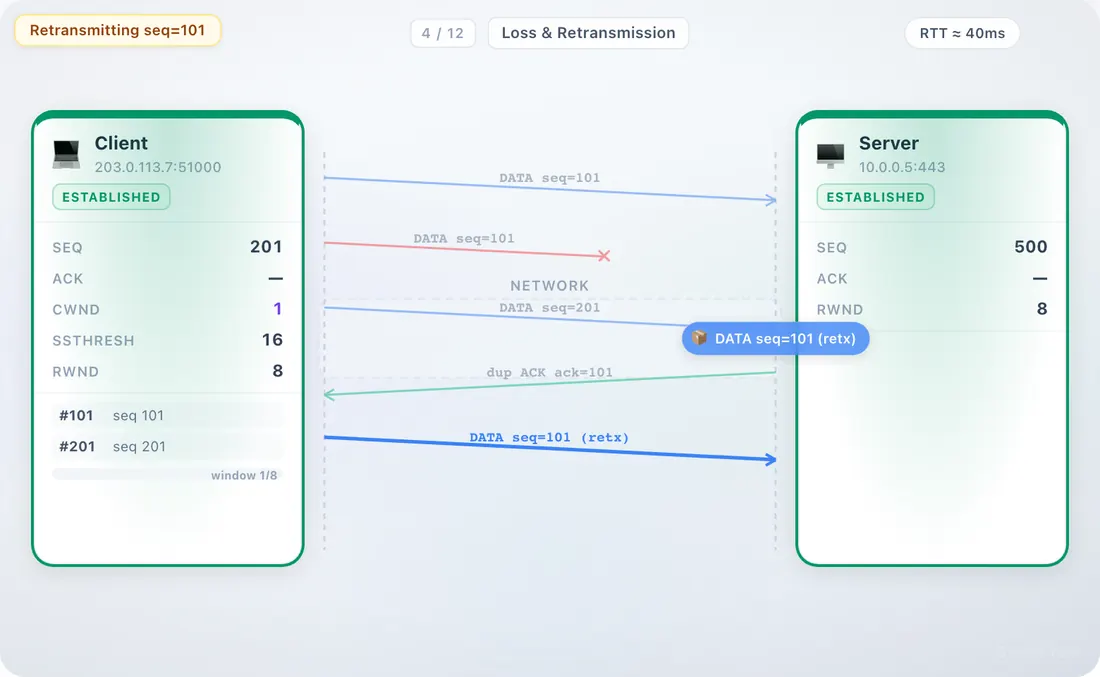
TCP journey: a segment with seq=101 is dropped in the network, the server returns a duplicate ACK for 101, and the client retransmits seq=101.

Networking · TCP Fundamentals · Scene 4, Loss & Retransmission

TCP: a lost segment and its recovery

A dropped segment is invisible in a static diagram. Here segment 101 is lost on the way to the server, the next segment still arrives, and the server answers with a duplicate ACK for the byte it is still missing. The client then retransmits the same segment with the same sequence number. Later scenes show the congestion window reacting to loss.

Open the TCP visual journey
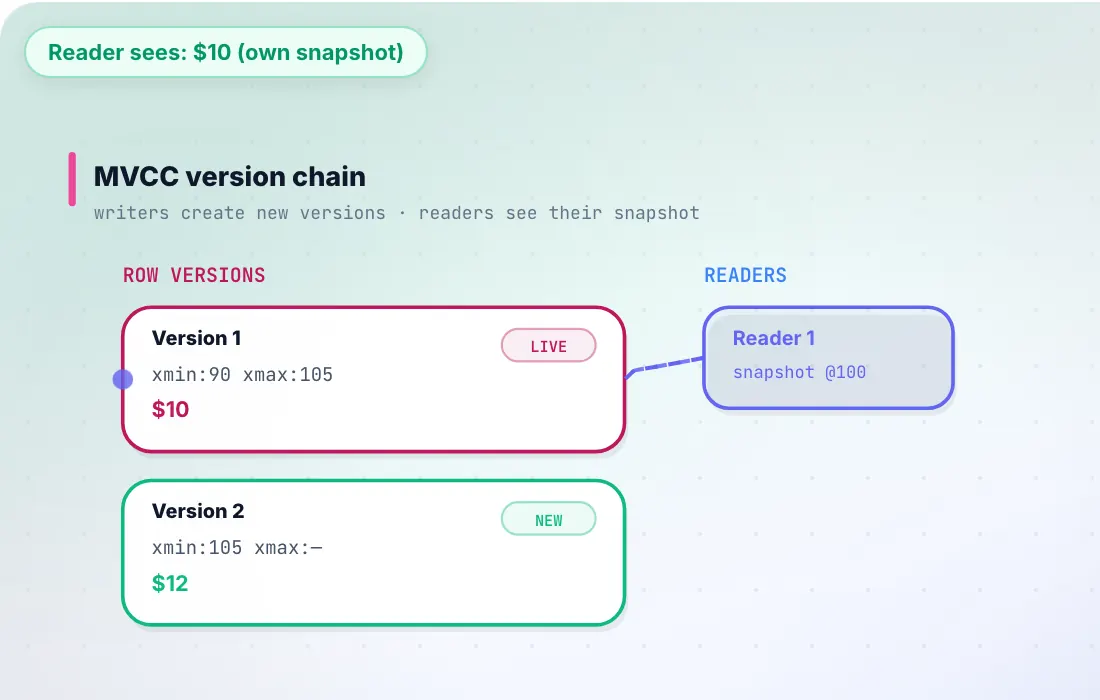
PostgreSQL MVCC journey: version 1 of a row (xmin 90, xmax 105, $10) and version 2 (xmin 105, $12), with a reader whose snapshot still sees $10.

Databases · PostgreSQL Fundamentals · Scene 8, MVCC

PostgreSQL: readers don’t block writers

A reader takes a snapshot. A writer updates the price, and PostgreSQL does not overwrite the row: it marks the old version with the writer’s transaction ID and inserts a new version. The reader keeps seeing $10 from its snapshot while the new $12 version exists alongside it. Later, VACUUM removes the version no snapshot needs any more.

Open the PostgreSQL visual journey
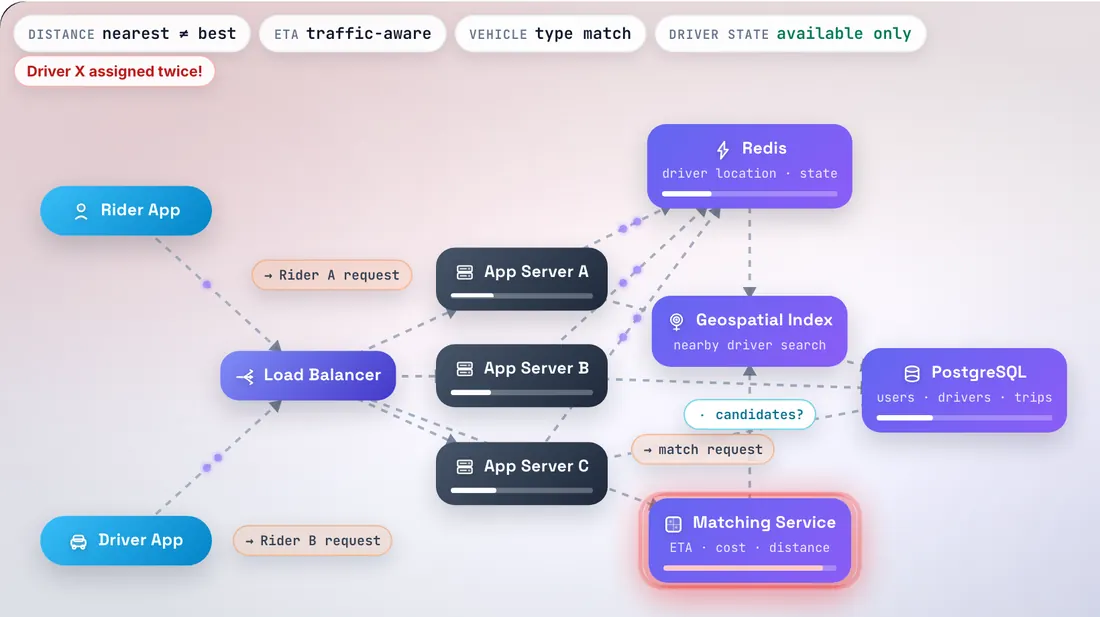
Ride-hailing design journey: requests from Rider A and Rider B reach the matching service at the same time and the stage warns “Driver X assigned twice”.

System Design · Designing a Ride-Hailing Platform · Complete Design

Ride-hailing: two riders, one driver

Two riders request a ride at almost the same moment. Both see Driver X as available and both try to assign him. The journey shows the double assignment, introduces an atomic update, and replays the moment: one rider wins and the other is re-matched to the next best driver. Across the journey the same design grows from a single server to a sharded, event-driven system, with each change prompted by a visible problem.

Open the ride-hailing design journey

Links open each journey at its first scene; use the step controls to reach the part described.

Standards

Rules the lessons are written against.

These come from SeeItFlow’s written authoring guidelines. They shape what a lesson shows, in what order, and how confidently it speaks.

Show the problem before the solution.
A mechanism is not explained before the learner has seen why it is needed.
No absolute technology claims.
“For this workload, Cassandra may fit better because…” rather than “Cassandra is better”. Engineering choices depend on context, and the lessons say which context.
Narration explains; it doesn’t read the screen.
If the diagram already shows something, the narration adds the reason for it.
State, not storyboards.
In a visual journey, what appears on screen corresponds to a change in the modelled system, not an arbitrary animation.
Accuracy

Accuracy, corrections and updates.

Technical content can be wrong, and details change between versions. This is how SeeItFlow approaches getting it right and fixing it when it isn’t.

How content is checked

Explanations draw on official documentation, specifications and established engineering literature, together with practical experience of building backend and distributed systems.

Automated tests also guard parts of the content itself. Some fail if a technical error corrected in an earlier review reappears, or if an internal authoring note leaks onto a page. Others check, for several system design journeys, that the narration script matches the scenes and their teaching order. The narrated visual journeys have also been reviewed at desktop and mobile sizes for clipped labels, unreadable states and animation that runs ahead of the narration.

How AI tools are used

SeeItFlow is developed with the help of AI tools, which assist with drafting, coding and building visual scenes. Narration is scripted to follow the visual scenes and is delivered using a synthetic voice.

AI assistance does not replace the work described above. Choosing what a lesson must explain, checking its technical details, and deciding what gets published remain the author’s responsibility.

Corrections

When an error is found, the lesson is corrected. Past corrections have covered replication and acknowledgement semantics, compaction tombstones, lease arithmetic and order-matching calculations.

Found a mistake? Email support@seeitflow.com with the page URL and what you believe is wrong. Reported issues are reviewed and the content is updated when a correction is needed.

What “Last updated” means

Lesson pages show the date their content last meaningfully changed. Styling and layout updates don’t move the date, so a recent date means the explanation itself was revised.

No paywall. No subscription. No account needed.

Every module on SeeItFlow is free to access. Signing in with Google is optional and only adds saved progress, saved lessons and Continue Learning, synced across your devices. Advertising is intended to help support the platform. Free access is not a reason to make lessons shorter or shallower.

Built to be usable by as many learners as possible

Your pace
Pause a visual journey, step back to the moment something changed, or replay it.
Reduced motion
Visual journeys follow your system’s reduced-motion setting, keeping the information on screen while toning down movement.
Phones and tablets
Lessons use responsive layouts, and the visual journeys have been reviewed at mobile sizes.
Text alongside the visuals
Every visual journey sits inside a full written lesson.
Mangesh Mandlik, creator of SeeItFlow

Created by

Mangesh Mandlik

Software Engineer · Backend & Distributed Systems

SeeItFlow is created and maintained by Mangesh Mandlik, a software engineer with 11+ years of experience working with backend and distributed systems.

He created SeeItFlow to make complex engineering concepts easier to understand by showing how systems behave, not just describing them.

Connect on LinkedIn

Who runs SeeItFlow

SeeItFlow is operated by Mangesh Mandlik, Bangalore, Karnataka, India.

SeeItFlow launched in August 2026.